Raw Data Reveal Reality: Title II and Neutrality Edition

Original photo by Flickr user Elliot P.
Here are some basic facts to keep in mind as legislation to restore Net Neutrality moves ahead in Congress.
On Tuesday morning, the Save the Internet Act of 2019 crossed its first hurdle when the House Communications & Technology Subcommittee passed a clean version free of any industry-friendly amendments.
This legislation, which will move soon to the full House Energy & Commerce Committee for a markup and vote, restores the Title II-based Net Neutrality policy framework that existed prior to Chairman Pai’s December 2017 repeal, which removed ISPs’ legal obligations to offer their internet-access services on a reasonable and nondiscriminatory basis.
During the full committee markup, there will undoubtedly be another parade of misstatements and outright falsehoods about the impact of the Title II-based Net Neutrality rules, as we saw from many Republican members during the subcommittee markup.
The representatives who have no concerns about unchecked ISP market power will use cherry-picked and flatly wrong statistics to claim Title II harmed investment and the public. They’ll even promote the bizarre notion that having some governmental oversight of monopoly price-gouging and other abuses is a bad thing.
Don’t believe them.
These cable-company defenders may have no compunction about using verifiable falsehoods. Many have no problem promoting the illogical notion that the mere presence of light-touch protections and authority have the power to scare ISPs into leaving money on the table. That’s absurd, considering the rewards they can reap from their dominance of this uncompetitive market.
As you follow this markup and this legislation as it moves through Congress, keep the following facts in mind:
Broadband-industry investment increased during the Title-II era, and declined following Chairman Pai’s repeal:
-
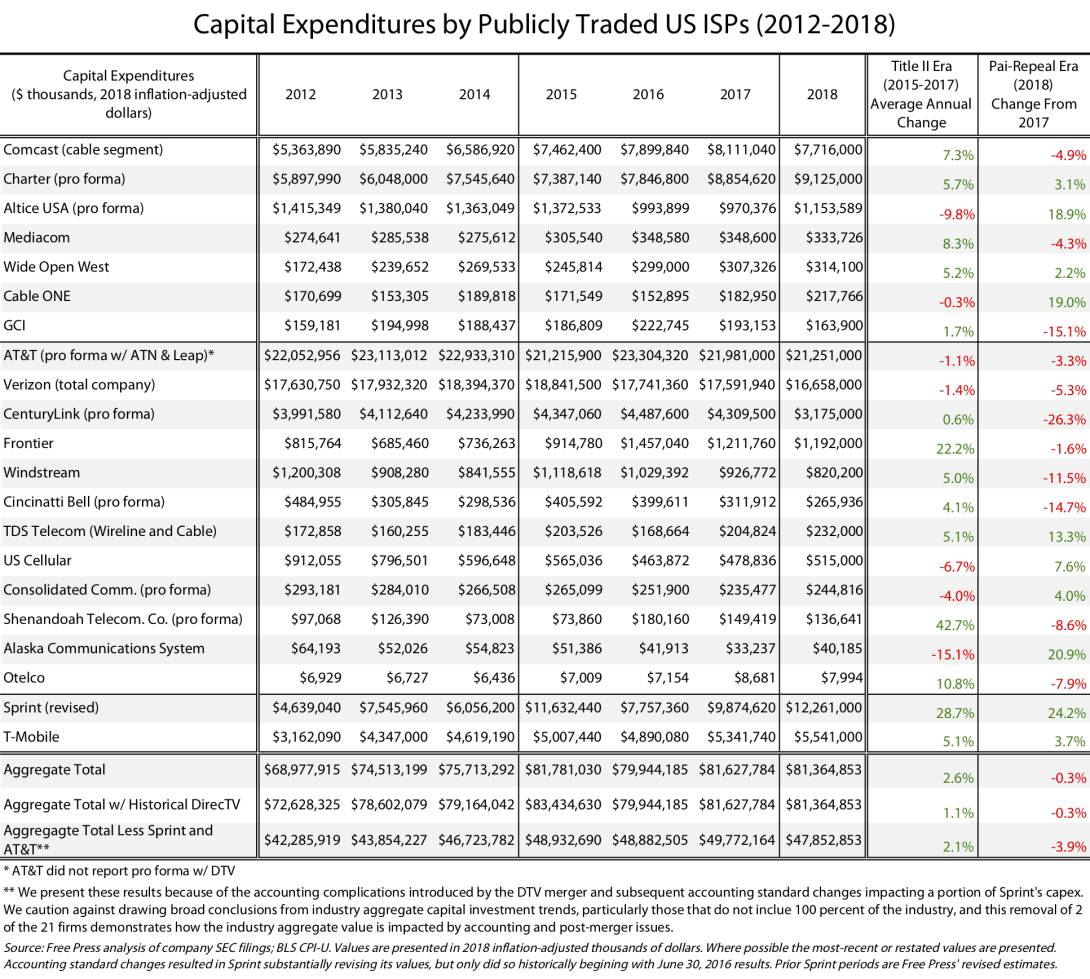
During 2015–2017 (the period the Title II-based Net Neutrality rules were in place), two-thirds of publicly traded ISPs saw their average annual capital investments rise. However, more than half of publicly traded ISPs reported lower capital investments during 2018, the first full year since the Title II-based Net Neutrality rules were eliminated.
-
Though industry-aggregate capital-investment figures can be highly misleading and don’t indicate any causal policy impact, the ISP industry saw aggregate capital-investment growth during the restored Title-II era, but lower aggregate investment during the first year of Title II’s repeal. The 2018 decline came despite the Trump tax cuts too, which — like massive deregulation at the FCC — were supposed to spur large investments. That didn’t happen.
Broadband deployment and competition grew substantially during the Title-II era, with cable-company ISPs quadrupling speeds and telephone-company ISPs making substantial capacity enhancements using fiber technologies:
-
Before the FCC adopted Title II-based Net Neutrality rules, only one out of every 10 people in the United States lived in an area where one or more ISPs offered downstream speeds at 250 Mbps or above. By the time Chairman Pai repealed Title II, three out of every four people in the country were able to access this next-generation-level service from at least one ISP.
-
The U.S. broadband market remains a duopoly, but the cable industry’s dominance was challenged during the Title-II era as telephone-company ISPs made historic investments in fiber-based technologies capable of delivering faster transmission speeds. At the end of 2014, only 34 percent of people in the United States lived in an area served by two or more wired ISPs offering downstream speeds at 25 Mbps or above, the FCC’s minimum standard for broadband. But the telcos made substantial investments, particularly during 2015 and 2016, and by the end of the Title-II era six out of every 10 people in the nation could choose between two or more wired ISPs offering those speeds.
-
During the Title-II era, the average maximum downstream speed available from cable providers increased nearly five-fold, and the average maximum available DSL speed more than doubled. Telephone companies also ramped up fiber-to-the-home (“FTTH”) deployment in the Title-II era, with FTTH availability increasing from one out of every five people to one out of every three.
After years of steady increases, internet-access prices declined during the Title-II era. Internet-access prices have moved higher since Chairman Pai repealed the Title-II prohibition against unjust and unreasonable rates:
-
Though changes in internet-access prices are difficult to compare meaningfully over time (due in part to bundling of broadband with TV and voice services, promotions, differing quality tiers and additional fees such as equipment rentals and overage penalties), data indicate prices declined during the Title-II era.
-
According to the Bureau of Labor Statistics (“BLS”), the Consumer Price Index (“CPI-U”) for internet services and electronic-information providers rose by 2.7 percent between January 2009 and February 2015. This corresponds to an annualized increase of 0.4 percent.
-
But the CPI-U for internet services declined 3.6 percent during the Title-II era (March 2015 through December 2017). This corresponds to an annualized decrease of 1.3 percent.
-
Prices have risen during Chairman Pai’s post-Title II era. From January 2018 through February 2019, the CPI-U for internet services rose 1.7 percent. This equates to an annualized increase of 1.5 percent.
-
-
Wireless prices also saw greater declines during the Title-II era, with prices dropping faster than they did in either the years preceding the 2015 Open Internet Order or the time since Chairman Pai repealed it.
-
The BLS CPI-U for wireless services declined by 2.3 percent on an annualized basis from January 2009 through February 2015.
-
But during the Title-II era (March 2015 through December 2017) the CPI-U for wireless services declined by 4.4 percent on an annualized basis.
-
The decline in the wireless services CPI-U during the Title-II era slowed substantially following Chairman Pai’s repeal. Between January 2018 and February 2019, the wireless services CPI-U declined by 2.8 percent on an annualized basis.
-
Because a picture is worth a thousand words, below we present some figures capturing some of the above data. These are but a few of the facts that should inform the debate about the impact of Title-II authority and Net Neutrality on U.S. broadband deployment.
And the picture from this data is clear: Title II’s return brought with it certainty about the prospects for broadband providers, internet companies and internet users alike. It did nothing to change the status quo of a slowly but surely improving broadband market, as technology evolved and investment cycles continued.
Though this raw information isn’t a Rorschach Test, many policymakers and ISP industry shills will undoubtedly continue to see whatever they want to see in whatever cherry-picked data they can dig up. And some reporters will pass along their inaccurate conclusions without attempting to dig further for the truth.
That’s too bad. A table of information, such as the one below tracking publicly traded ISPs’ historic capital investments, should serve as a starting point for further questions and thought.
For example, look at Verizon’s capital spending, which peaked in 2015 and declined sequentially thereafter. Those are the data, but they tell you absolutely nothing about why the company’s capex trended that way.
Dig a little further and you’ll discover that Verizon’s wireless-segment investments increased by more than one-third between 2012 and 2015 as the company expanded and enhanced its nationwide LTE network. Those investments then declined by nearly one-third between 2015 and the end of 2018 because that upgrade was complete, and the company didn’t need to invest as much as it signed up customers and awaited the start of the 5G era. But Verizon’s wired investments, on the other hand — after nearly a decade of decline — increased by 40 percent between 2016 and 2018.
The reasons for these diverging investment paths aren’t a mystery: Anyone can read numerous Verizon statements and get an understanding of what drives its investment decisions. And — surprise — it isn’t Title II or the FCC’s policy generally. It’s technology, demand for service and the competition that any company faces that drives its thinking. This is true for all ISPs, as we’ve documented in great detail numerous times.
But people like Chairman Pai aren’t interested in truth; they’d rather limit understanding of this market to specious ideology, where any hint of public-interest protection will supposedly foster disaster while policies that favor industry always bring bounty.
Though there’s copious evidence that restoring Title-II authority and basic Net Neutrality rules had no impact on ISPs’ investment, it’s true that Title II contains a prohibition against unreasonable pricing and conditions. This prohibition is at the core of why the ISP industry loathes Title II.
It’s interesting that the BLS CPI-U data for internet services declined during the Title-II era, something not seen in the years leading up to the 2015 vote or since.
Perhaps during the restored Title-II era the ISPs (particularly the cable-company ISPs, which enjoy a near-monopoly over the fastest-speed service) were hesitant to continue using their pricing power for fear it could trigger FCC action? Perhaps then a basic regulatory backstop (though one the FCC has rarely used) protecting users against the worst monopoly abuses is a good thing to have in an industry that has so little competition?
Correlation isn’t causation. But turnabout is fair play.
Chairman Pai and his enablers in Congress have played fast and loose with the facts for years, but even they will struggle to cherry-pick from the post-Title-II era data to support their bogus belief that the Net Neutrality repeal was good for broadband providers or users.
So, as we make our way through another round of Title-II battles, we hope this data can help ground the debate in reality.
It figures
The chart below shows the inflation-adjusted capital investments for publicly traded U.S. internet-access providers. Of all the data in this debate, capital investments get the most attention. And in the wrong hands — like Chairman Pai’s — capital-investment data are frequently used to mislead people.
Look at how divergent the values are at the company level. Look how much work needed to be done to account for mergers and acquisitions (the “pro forma” accounting). Look how much the 2018 accounting-rule changes, which had the largest impact on Sprint, can swing the aggregate value.
So, the aggregated bottom line is at best a starting point for a conversation about what individual companies did, why some invested more but others invested less, and why they did it.
The obsession over how much money ISPs invest has always been odd.
Why should people care if an ISP spent billions to construct a new headquarters, an expenditure that will show up in its capital investments? What matters is whether internet users see improvements in the quality of services available to them, and whether they see more competition for their business — not how much money ISPs spent to get those results.
And the data on this point of broadband deployment in the Title-II era is stunning. Consider, for example, the percentage of the population with access to broadband, and the speeds available to them:
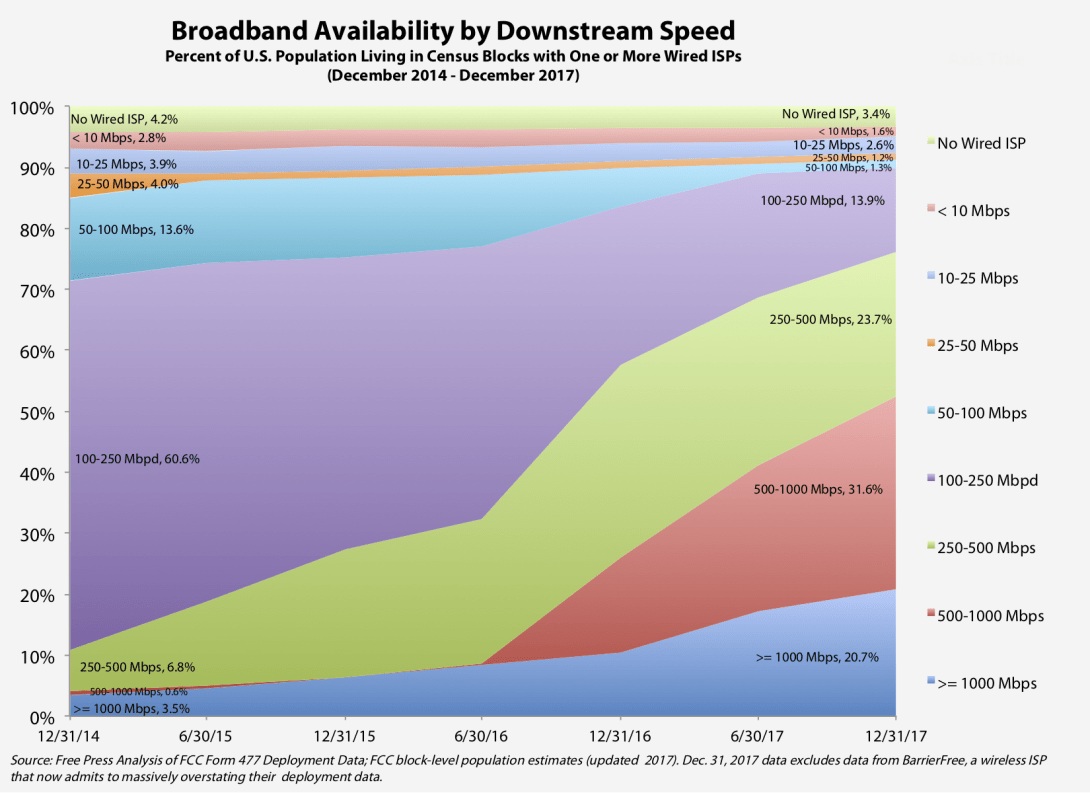
This chart shows the entire U.S. population, grouped by the level of broadband service deployed in their neighborhood, from just prior to the FCC’s restoration of Title II through Chairman Pai’s vote to repeal the law and the Net Neutrality rules. (The year-end 2017 deployment data is the most recently published information.) This all indicates that deployment of broadband at ever-increasing speeds proceeded at a healthy pace during the Title-II era.
Swifter speeds are welcome, but what the above data largely reflect is cable-company ISPs deploying faster speeds as they began and then completed their so-called “DOCSIS 3.1” technology upgrades.
To be sure, these upgrades aren’t quite as inexpensive to make as the “couch change” it cost the cable companies to initially deploy the DOCSIS 3.0 technology. The large capacity boosts shown in the chart above (look at that red triangle!) are due in part to cable ISPs pushing fiber deeper into their networks, closer to their customers.
That costs money, though not nearly as much as it costs telephone-company ISPs to migrate their old first-generation DSL networks into today’s fiber-fed DSL and full fiber-to-the-home technologies. But during the Title-II era, telephone-company ISPs made substantial investments in these new technologies, which have the improved capacities today’s multimedia-focused internet users need.
The result of this competitive telco response is apparent in the following figure:
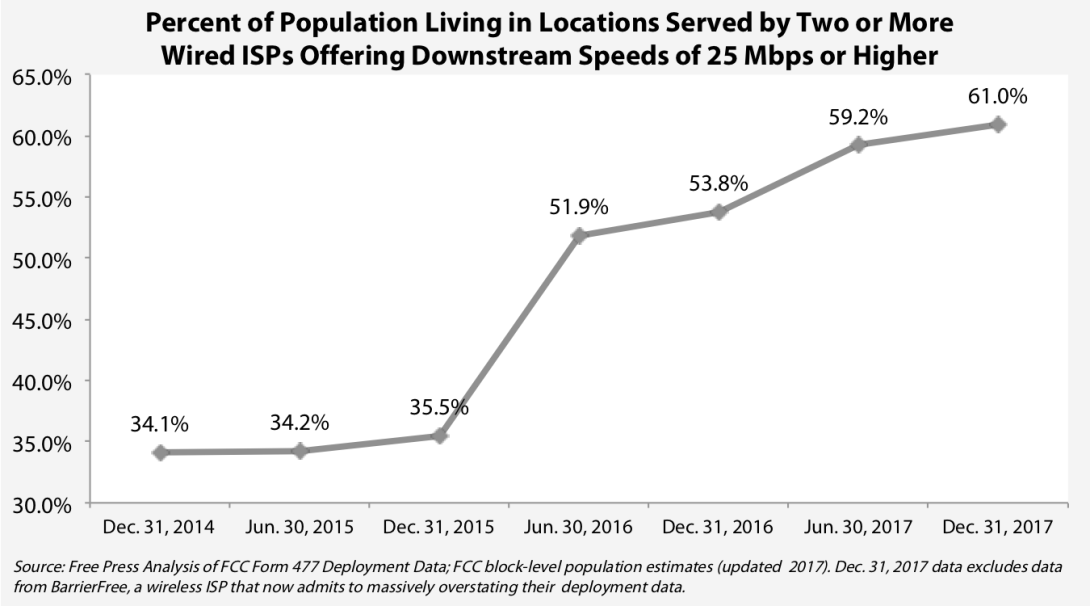
See that really large jump between the end of 2015 and the middle of 2016?
That impressive increase was due almost entirely to AT&T — one of the most vocal anti-Title II companies — upgrading its old DSL lines. (It’s worth noting that AT&T took on that upgrade in 2015 and 2016, even before it agreed to a merger condition to get its DirecTV merger approved, and agreed to build out FTTH to 14 million premises during the latter part of 2016 through the end of 2017.)
Prior to the FCC’s February 2015 vote to restore Title II, a mere 3.5 percent of the people living in AT&T’s service area could purchase 25 Mbps-level or higher internet-access services from the company. But by the end of 2017, more than 70 percent of AT&T’s internet-access lines had downstream capabilities at 25 Mbps or higher.
And while it’s by far the largest telephone-company ISP, AT&T certainly isn’t the only one that made substantial network improvements during the Title-II era. At the end of 2014, just over half of CenturyLink’s internet lines could deliver speeds above 25 Mbps. But by the end of 2017, nearly two-thirds of its lines met or exceeded this capability.
To be clear, a duopoly doesn’t count as real competition. And even with the historic improvements seen during the restored Title-II era, we still have a market where nearly four out of every 10 people has at most one option for a home-broadband ISP that sells service meeting the FCC’s 25 Mbps minimum-speed standard.
And at the next-generation-level speeds increasingly required to enjoy all the possibilities of streaming video and the cable-TV cord-cutting era, the cable industry’s broadband monopoly is even more stark.
While 90 percent of the U.S. population lives in an area served by a wired ISP offering downstream speeds above 100 Mbps, less than half has a choice between two or more ISPs offering this speed. Three-quarters of the population can buy service with downstream speeds above 300 Mbps, but only one-quarter has a choice of ISPs at this service level.
The lack of home-broadband competition has consequences, many of which may show up in the bills we pay every month.
Competition can keep firms from exercising market power by hiking prices unnecessarily or forcing customers to rent cable-TV boxes and modems. Competition can also incentivize firms to wholesale their excess capacities, something we commonly see in the more competitive wireless market, but is nearly absent from the wired-internet market. The lack of competition can also show up in other ways, such as wired providers eliminating “budget” tiers, the lower-capacity offerings that are critical to households with lower incomes.
The United States has long favored competition over regulation to keep anti-competitive behaviors in check. But in the telecom market, where new entry is impossible and where natural monopoly economics result in just a handful of competitors, there’s a need for a regulatory backstop against the worst-of-the-worst monopoly abuses.
This doesn’t mean that the FCC should set rates; it just means that there’s a potential pressure relief valve for people to use in specific cases when an ISP does something egregious. We’ve previously documented how rare it is for the FCC to use this authority. But it’s true that the mere potential for the agency to act can keep firms from engaging in blatant monopoly pricing.
This could help explain the BLS CPI-U pricing data for internet services discussed above, and shown in this chart:
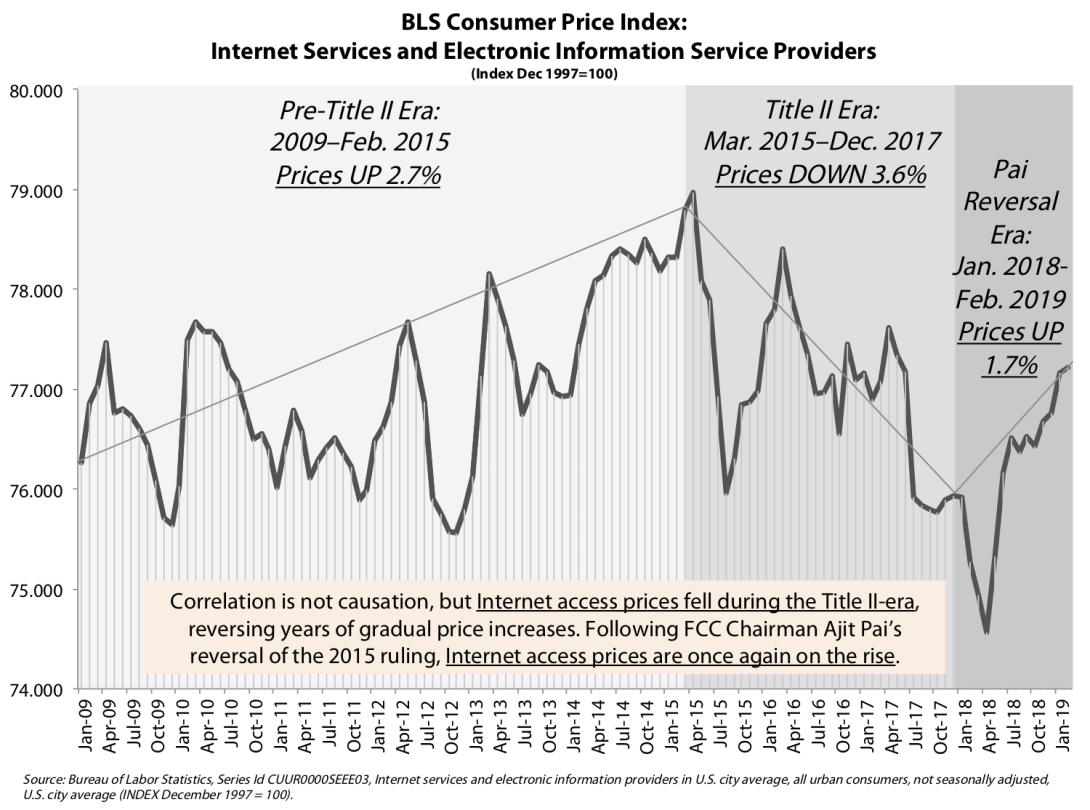
Though the data series is lumpy, the BLS’ price index for internet services declined during the restored Title-II era, after climbing previously. And in the absence of Title II, prices are rising once again.
It would be foolish to conclude in isolation a causal impact of Title II authority on prices, just as it’s foolish to find causation with investment. But the mechanism of potential regulatory intervention holding pricing abuses in check — no matter how unlikely it is for this FCC or any FCC to intervene — is far more plausible than ISP claims about Title II reducing investment.
This is, after all, a market that generates large profits for entrenched incumbents. Investment is a given; monopoly-level prices might be as well, unless there’s something in place to discourage this practice.
The industry’s slams against Title II have clouded its purpose: to protect the public interest while fostering private innovation and investment. All of the available data above and elsewhere indicate that Title II did this job quite well, and Congress has ample reason to restore these important legal protections that Chairman Pai so callously tossed aside.