Trump's Advisers Get It All Wrong on the Save the Internet Act
Flickr user Mike Mozart
The Trump administration on Monday issued a Statement of Administration Policy (or “SAP”) recommending a veto of the Save the Internet Act if that bill reaches the president’s desk.
Let’s forget for a moment that the SAP is chock full of inaccurate legal claims about what the bill would do. Let’s even ignore, when assessing this veto “threat,” Trump’s tendency to ignore what his own advisers tell him to do.
Let’s focus instead on three inaccurate and incoherent claims the SAP makes about the state of broadband investment and deployment since the Trump FCC repealed the Net Neutrality rules and the proper Title II legal framework for them in December 2017.
SAP claim:
“In 2018, fiber was … made available to more new homes than in any previous year … ”
For the backstory here, see Free Press’ letter exposing flaws in the FCC’s broadband-deployment data for 2017, based on over-reporting by a single ISP called BarrierFree.
But this fiber-deployment claim in the SAP is not based on that flawed FCC data, because the agency’s numbers only go through 2017 at this point and the SAP talks about 2018.
The Free Press filing on this topic debunked a press release issued by FCC Chairman Pai in which he crows about the inaccurate numbers. This is how we responded to Pai’s overblown fiber claims:
Pai: “The private sector has responded to FCC reforms by deploying fiber to 5.9 million new homes in 2018, the largest number ever recorded.”
Reality: BarrierFree’s erroneous reporting will have a substantial impact on the counts of blocks gaining [fiber-to-the-home, or “FTTH”] service.
The reference to 2018 indicates Chairman Pai is relying on third-party data, not Form 477 (the form broadband providers use to provide information on their service areas). We question why the FCC’s Broadband Deployment Report would cite unauditable third-party data when its own Form 477 data tracks FTTH deployment.
According to the historical Form 477 data, the number of households in an area with FTTH deployment increased by 2 million during 2015, by 6.6 million during 2016 and by 6.1 million during 2017 (excluding BarrierFree’s reporting). That means the FCC data indicate that 2016 saw more FTTH deployment than the chairman’s cited claim for 2018.
-
What that means for the Trump administration’s SAP — based on our analysis of what might be phony FCC numbers to begin with — is that the (hidden) number likely being recycled from Chairman Pai’s press release is lower than the fiber-growth figures for 2016.
SAP claim:
“Since the new rule was adopted in 2018, consumers have benefited from a greater than 35 percent increase in average, fixed broadband download speeds …”
Also wholly unsubstantiated, this claim ignores the fact that average maximum fixed-broadband speeds have been steadily on the increase for the last half decade. Broadband speeds get faster over time, of course. This is no surprise. Nothing about the adoption of the 2015 rules or their repeal changes this.
This SAP claim seems to be based on Ookla speed-test data.
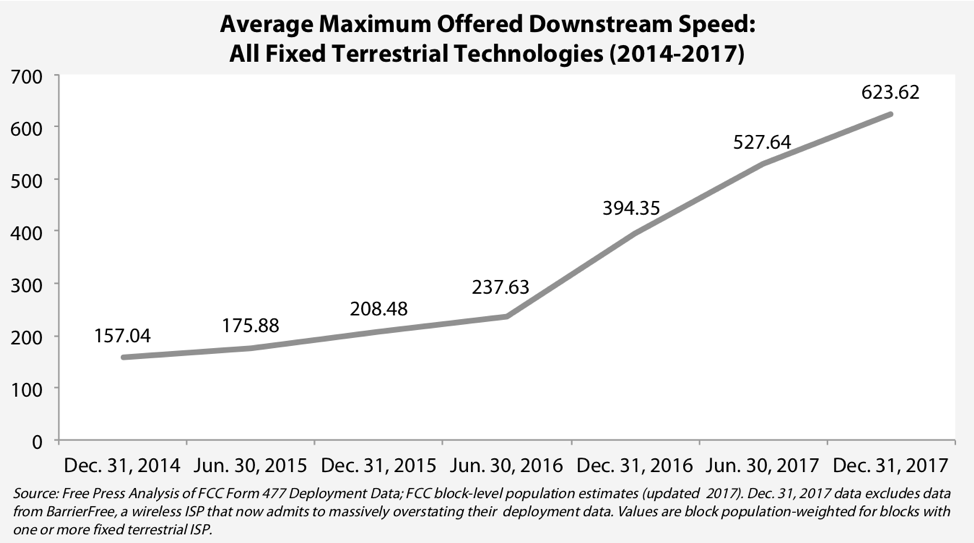
Yet Free Press has shown, using corrected FCC deployment data, that average maximum speeds available in the United States have been rocketing up for years — based not just on fiber deployments but on cable companies’ DOCSIS 3.1 rollouts and legacy telephone-company ISPs’ DSL improvements over time.
Here’s the chart on this trajectory, then the summary:
-
What that means for the SAP is that 35-percent growth is not just an unreliable number, but an unimpressive one. Based on the average maximum fixed-broadband speeds available, growth in average maximum speeds was 33 percent in 2015; 89 percent in 2016; and 58 percent in 2017, before the Pai FCC voted its repeal in December 2017.
How is that possible? Fiber-to-the-home and the latest state-of-the-art, fiber-fed cable technologies have been made available to more and more people in the country over the past several years. Nothing about what the FCC adopted in the 2015 Open Internet Order — or later undid with Chairman Pai’s repeal — changed that trajectory.
Even if we were using the Ookla data (which is gathered with insufficient experimental controls, and also isn’t very informative because it varies widely based on what speed tiers customers buy) Ookla claimed a 42-percent increase in fixed-broadband download speeds in 2016.
So is the 35-percent increase claimed in 2018 very good, even if it’s reliable?
No.
SAP claim:
“In 2018, … capital investment by the Nation’s top six Internet service providers increased by $2.3 billion.”
It’s impossible to overstate just what a flawed number this is.
Who is the administration including as its “top six” ISPs? Wireless carriers, which serve tens or even hundreds of millions of customers? Legacy phone companies like AT&T and Verizon, which have both wireless and wired businesses? Cable companies that have a lot more wired customers than legacy phone companies have these days for their wired offerings, but still far fewer than AT&T and Verizon do between their wired and wireless businesses combined?
We have no idea.
And what does a $2.3 billion “increase” mean in this context? Is that in line with, or perhaps even lower than, the percentage increases in previous years? The SAP hides the ball and doesn’t even pretend to tell us what it’s measuring.
But set aside the fact that the SAP’s claims are utter fantasy, utter garbage or both. Let’s even ignore the fact that sheer dollars invested is a ridiculous way to measure broadband performance, since users care only about whether their speeds, coverage and choices get better (not how much money the cable or phone company invests); and since those companies want to improve those metrics while spending less to do it when they can, just as they can when technology gets cheaper.
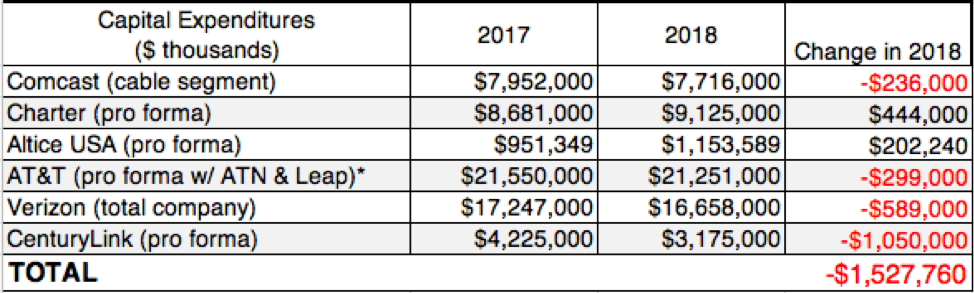
Let’s just assume that “top six” ISPs means Altice, Charter and Comcast on the cable side, and AT&T, CenturyLink and Verizon on the telco side. Whether we look at inflation-adjusted or nominal values, these companies did not invest $2.3 billion more in 2018 than they did in 2017.
In fact, four of those six companies saw investment declines in 2018, and the total decline for all of them put together was more than $1.5 billion. (That’s using nominal-dollar values; for these six, the inflation-adjusted decline would be an even bigger figure, as our chart on the last page here shows.)
-
What that means for the SAP is that unless it offers some magical way to slice and dice the numbers, the “top six” publicly traded wired ISPs didn’t invest $2.3 billion more than they did collectively in 2017. In fact, they spent $1.5 billion less.
Our numbers are all based on the ISPs’ own financial reports to their investors and the Securities and Exchange Commission, accounting only for historical changes in how companies like AT&T and Charter reported their financial results before and after acquiring other ISPs and pay-TV companies like DirecTV, Leap and Time Warner Cable.
As we’ve said dozens of times now, the increases and decreases attributable to these big ISPs over time are not caused by the adoption of Title II rules or by their repeal. Rather, they’re just part of the natural technological-upgrade cycle that hits different sectors (like cable, telephone companies and wireless companies) at different times.
But to claim that large ISPs increased their spending when they did just the opposite — whatever the natural cause is for such decreases — is a fraud designed to stop members of Congress from voting for strong open-internet rules that their constituents need and demand by 4-to-1 margins.
Lawmakers shouldn’t fall for this fraud, no matter what party they’re in. They should vote how their constituents — Republican, Democratic and independent alike — have told them to.
And that’s a vote for the Save the Internet Act of 2019.